R & Tidyverse
ggplot2
Una introduccion a la visualizacion de datos
Paul Efren Santos Andrade
@PaulEfrenSantos
19 August, 2019

Los paquetes
Simple: instalar tidyverse
install.packages('tidyverse')Medio: instalar unicamente ggplot2
install.pacakages('ggplot2')Avanzado: instalar desde GitHub
devtools::install_github('tidyverse/ggplot2')Tidyverse
library(tidyverse)## -- Attaching packages -------------------------------------------- tidyverse 1.2.1 --## v ggplot2 3.2.1 v purrr 0.3.2## v tibble 2.1.3 v dplyr 0.8.3## v tidyr 0.8.3 v stringr 1.4.0## v readr 1.3.1 v forcats 0.4.0## -- Conflicts ----------------------------------------------- tidyverse_conflicts() --## x dplyr::filter() masks stats::filter()## x dplyr::lag() masks stats::lag()Grammar of Graphics
ggplot2
 Hadley Wickham
Crear representaciones gráficas de nuestros datos es un paso clave para poder comunicar información y hallazgos a otros.
ggplot2 es un sistema para crear gráficos, basado en The Grammar of Graphics.
Usted proporciona los datos, le dice a ggplot2 cómo asignar variables, qué caracteristicas mostrar y esta se ocupa de los detalles.
ggplot2
Algunas razones
Visualizacion de forma esquematica
- Datos organizados
- Expresar los datos como elementos visuales
- scales, guides, axis, labels, theme
Secuencia comprensible de la creacion de graficos
Sencilla de replicar
Secuencia concistente
Con que estamos tratando?
ggplot2 es un gran paquete: filosofia + funciones
...muy bien organizadas
Con que estamos tratando?
ggplot2 es un gran paquete: filosofia + funciones
...muy bien organizadas
Muchos ejemplos de visualizacion impresionantes
...no estan en estas diapositivas
Con que estamos tratando?
ggplot2 es un gran paquete: filosofia + funciones
...muy bien organizadas
Muchos ejemplos de visualizacion impresionantes
...no estan en estas diapositivas
Quiza toquemos muchas ideas muy rapido
...pero conoceras donde buscar ayuda
Con que estamos tratando?
ggplot2 es un gran paquete: filosofia + funciones
...muy bien organizadas
Muchos ejemplos de visualizacion impresionantes
...no estan en estas diapositivas
Quiza toquemos muchas ideas muy rapido
...pero conoceras donde buscar ayuda
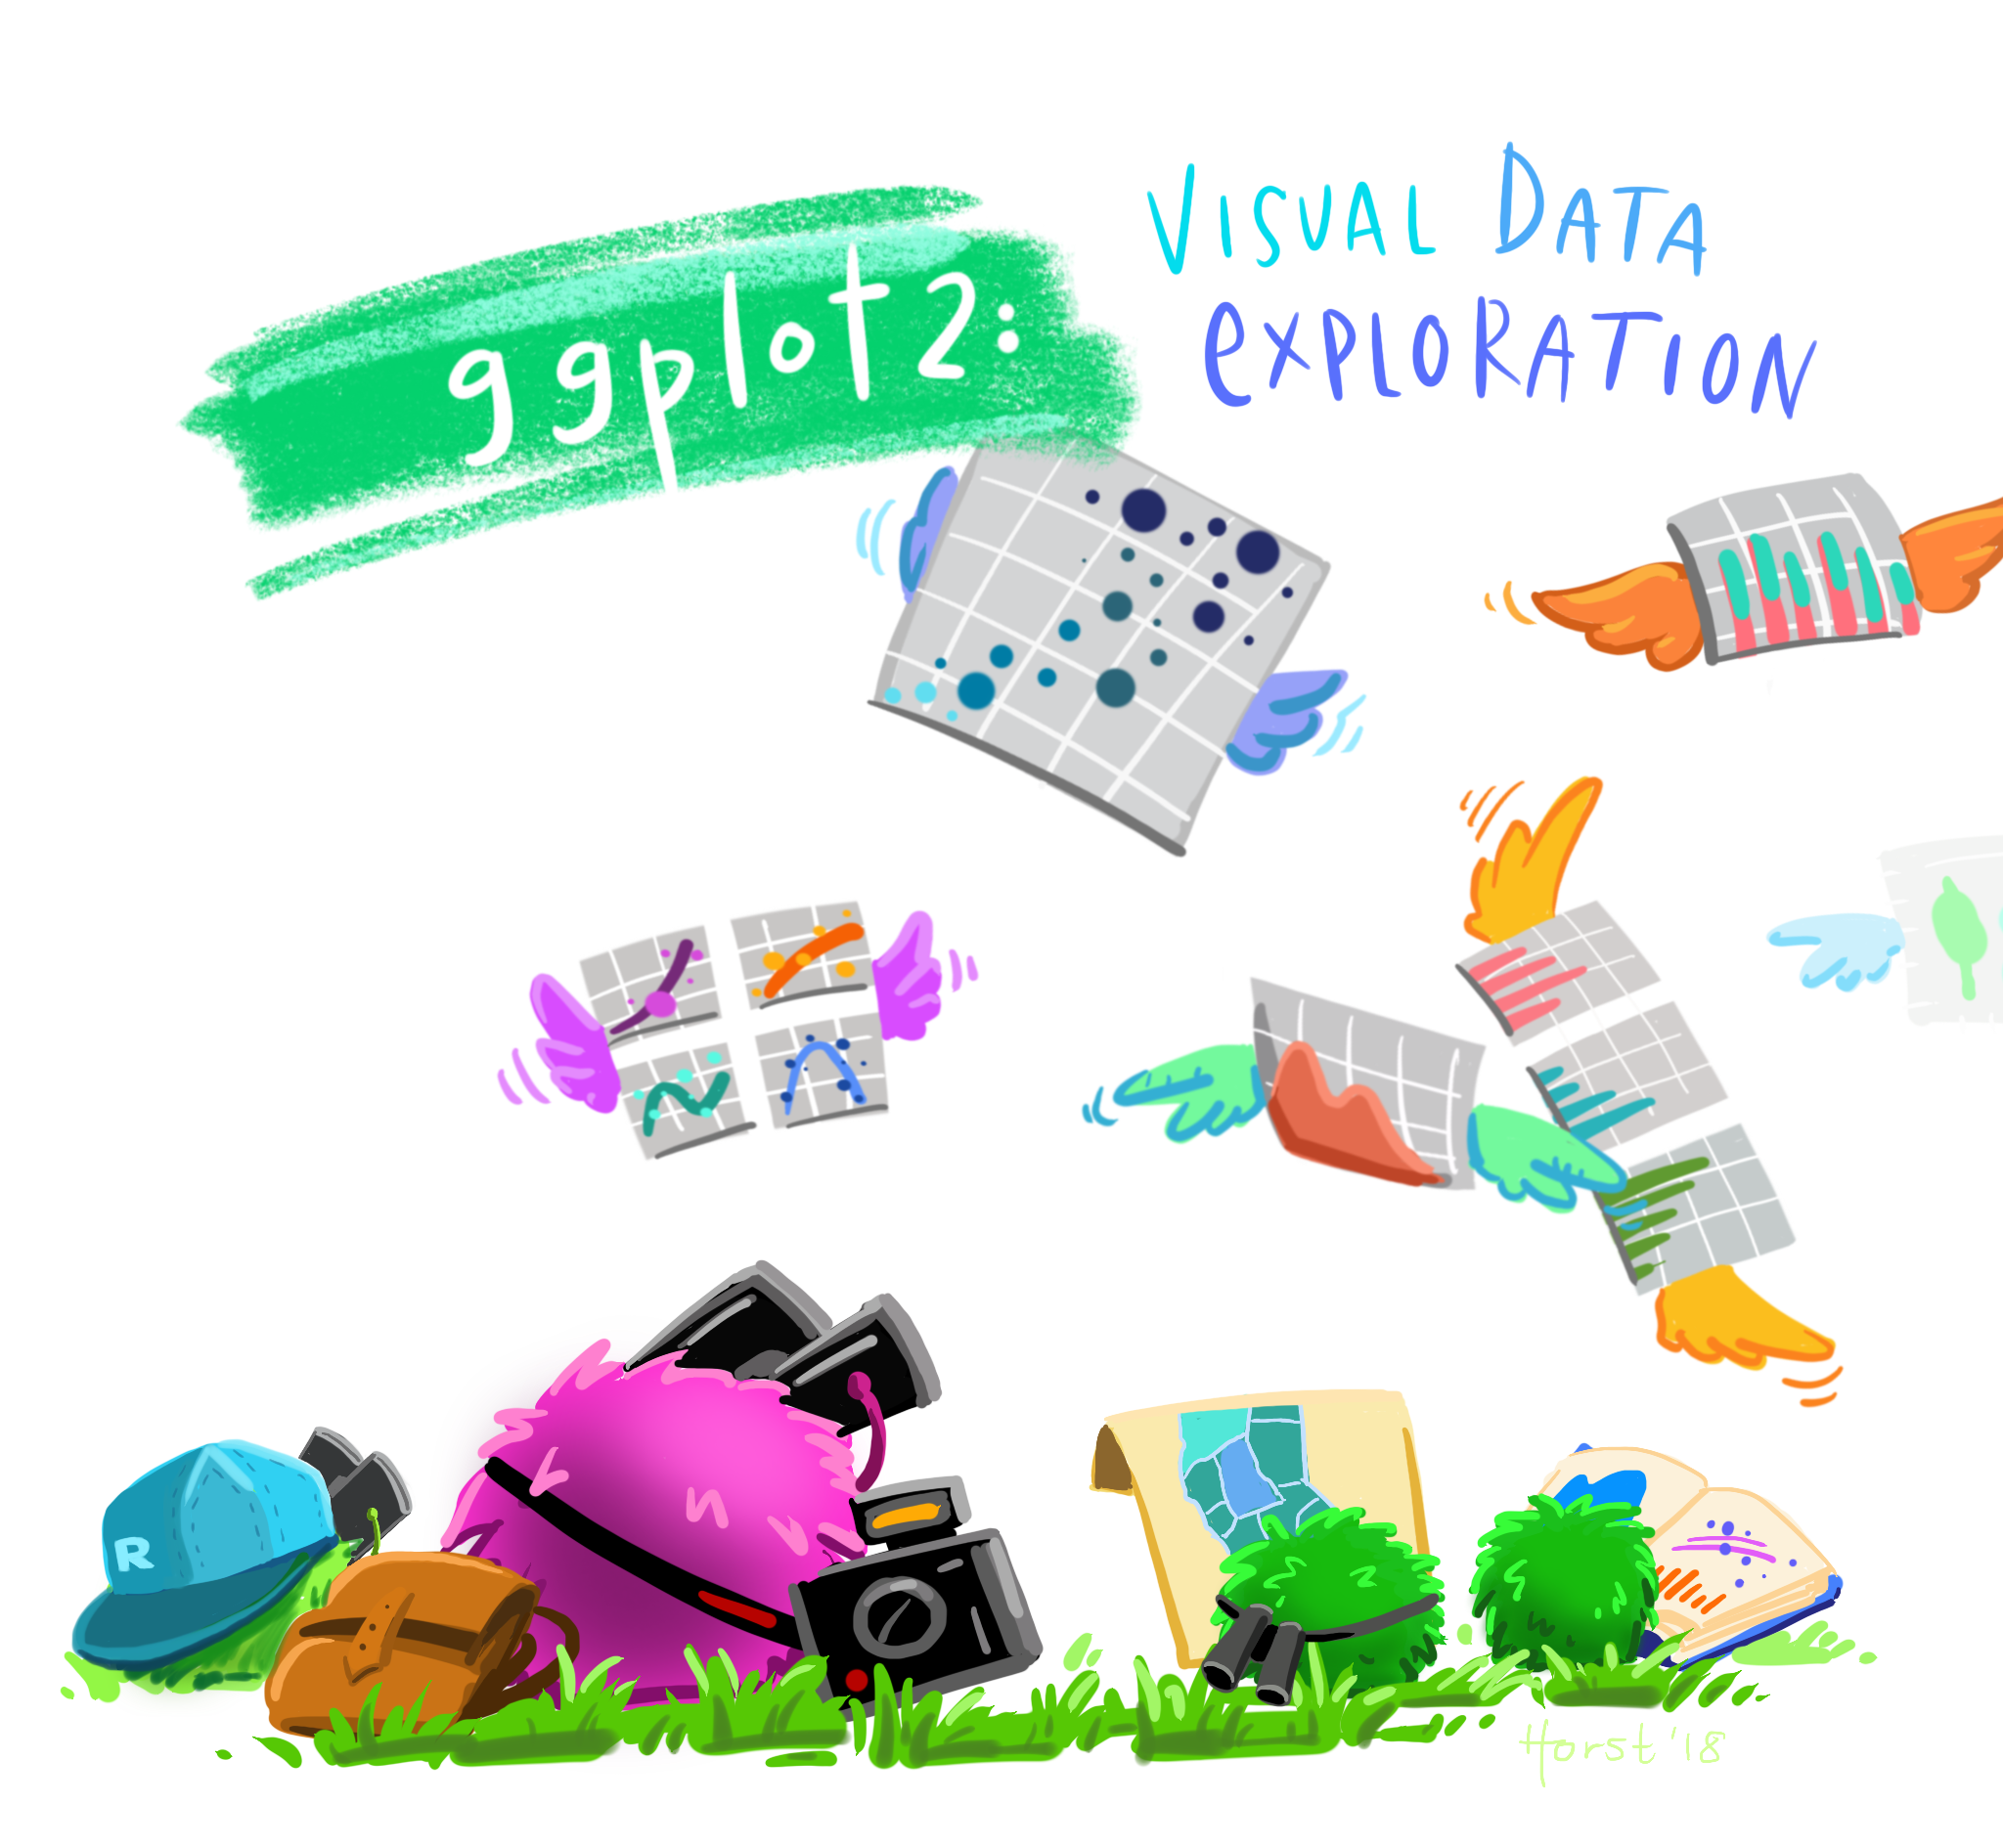 https://github.com/allisonhorst/stats-illustrations
]
Grammar of Graphics
Gramatica de visualizacion?
"Una idea clara de lo que deseas mostrar, encamina la construccion de un grafico."
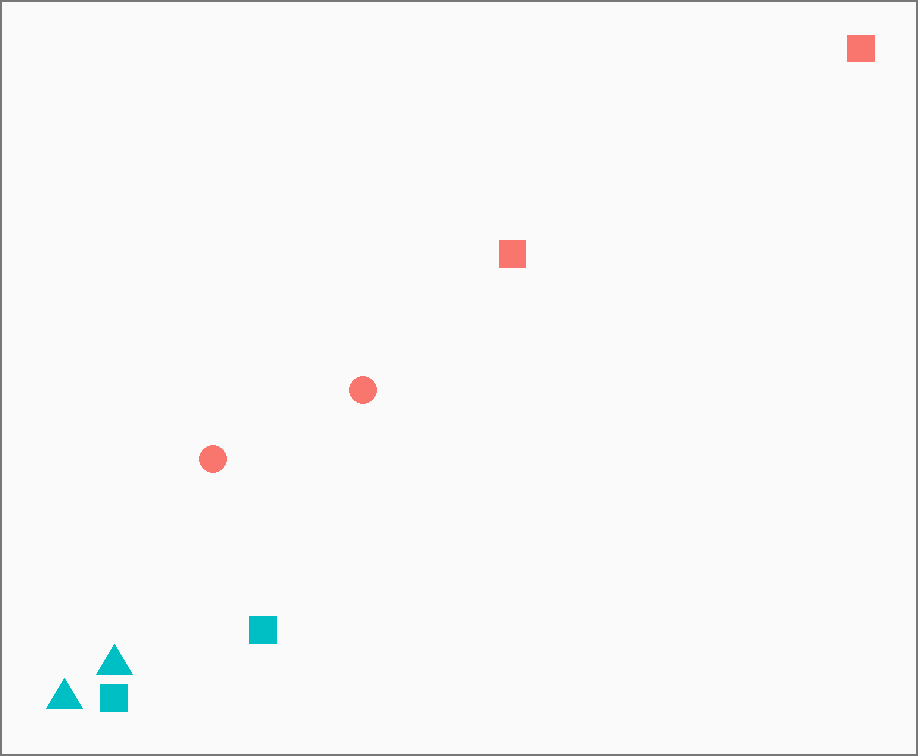
Que datos estan detras?
MPG
- Manufacturer
- Car Type (Class)
- City MPG
- Highway MPG
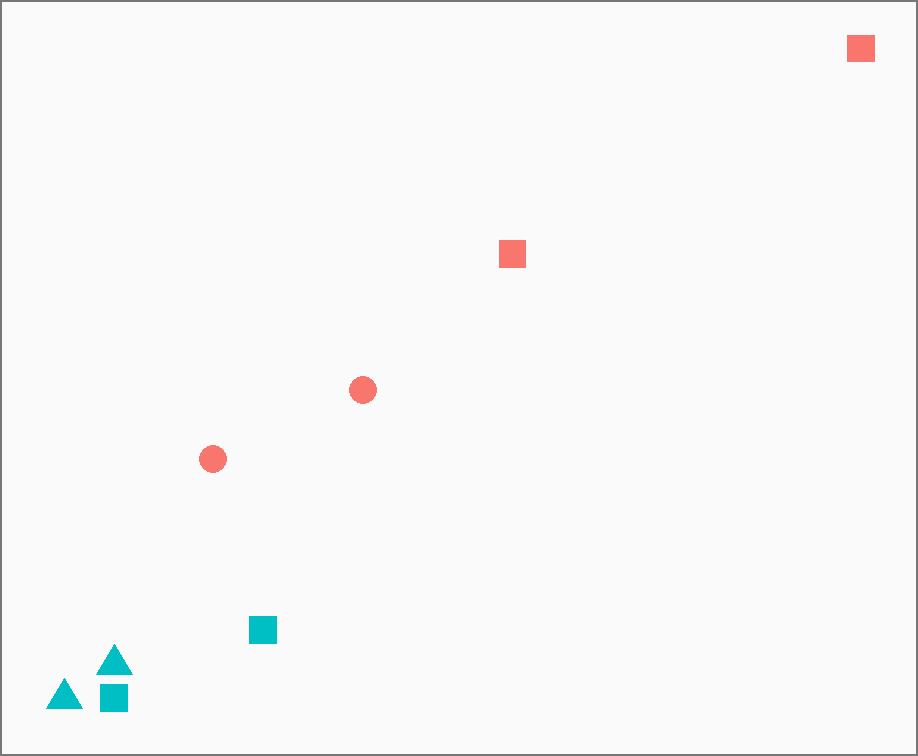
Que datos estan detras?
MPG
- Manufacturer
- Car Type (Class)
- City MPG
- Highway MPG
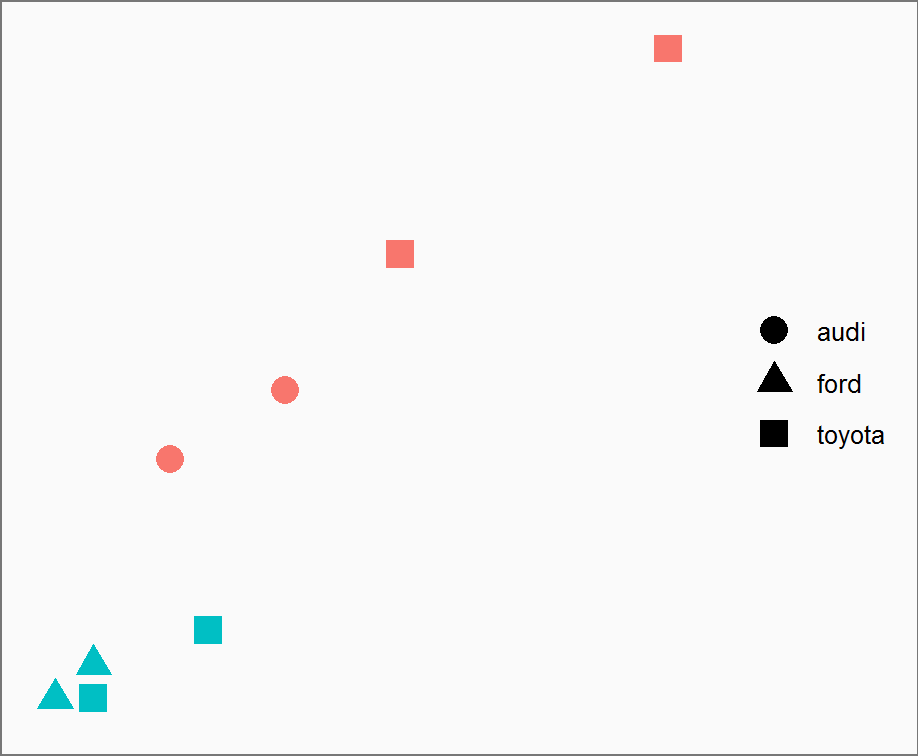
Que datos estan detras?
MPG
- Manufacturer
- Car Type (Class)
- City MPG
- Highway MPG
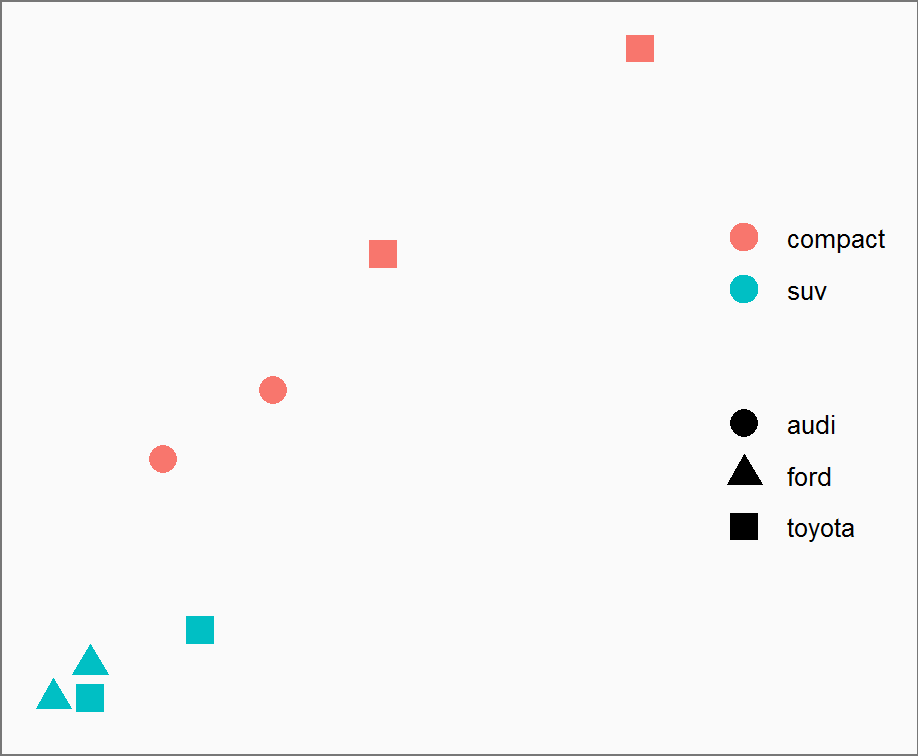
Que datos estan detras?
MPG
- Manufacturer
- Car Type (Class)
- City MPG
- Highway MPG
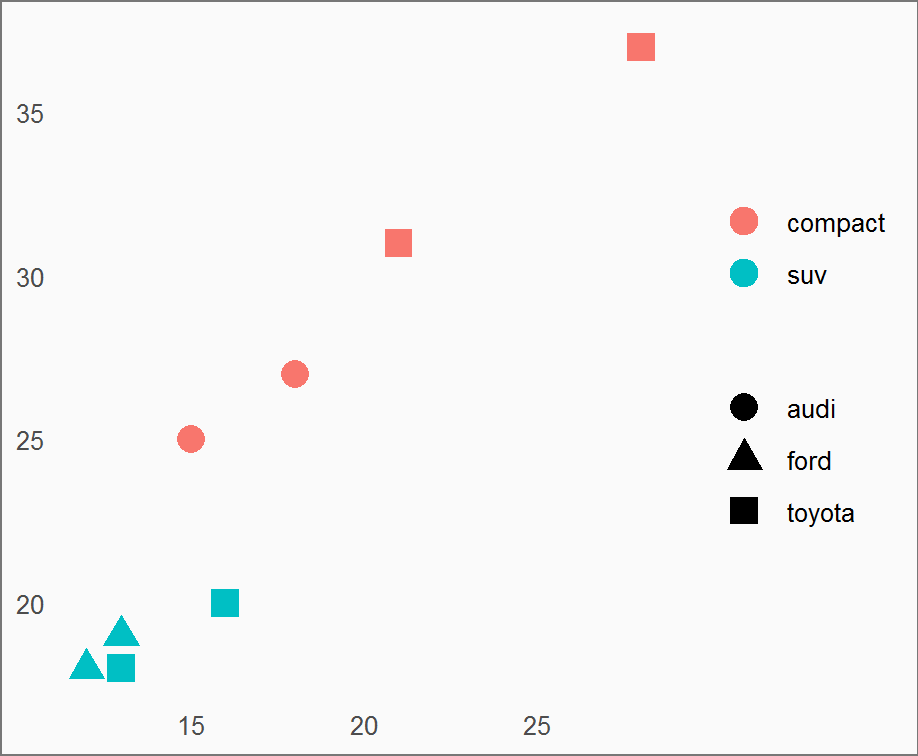
Que datos estan detras?
MPG
- Manufacturer
- Car Type (Class)
- City MPG
- Highway MPG
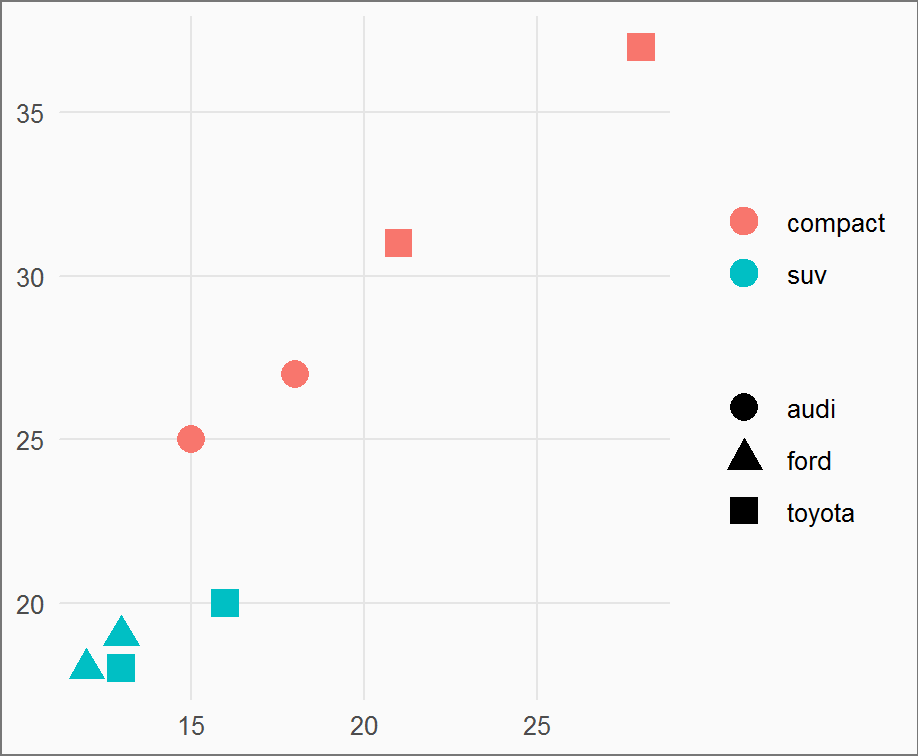
Que datos estan detras?
MPG
- Manufacturer
- Car Type (Class)
- City MPG
- Highway MPG
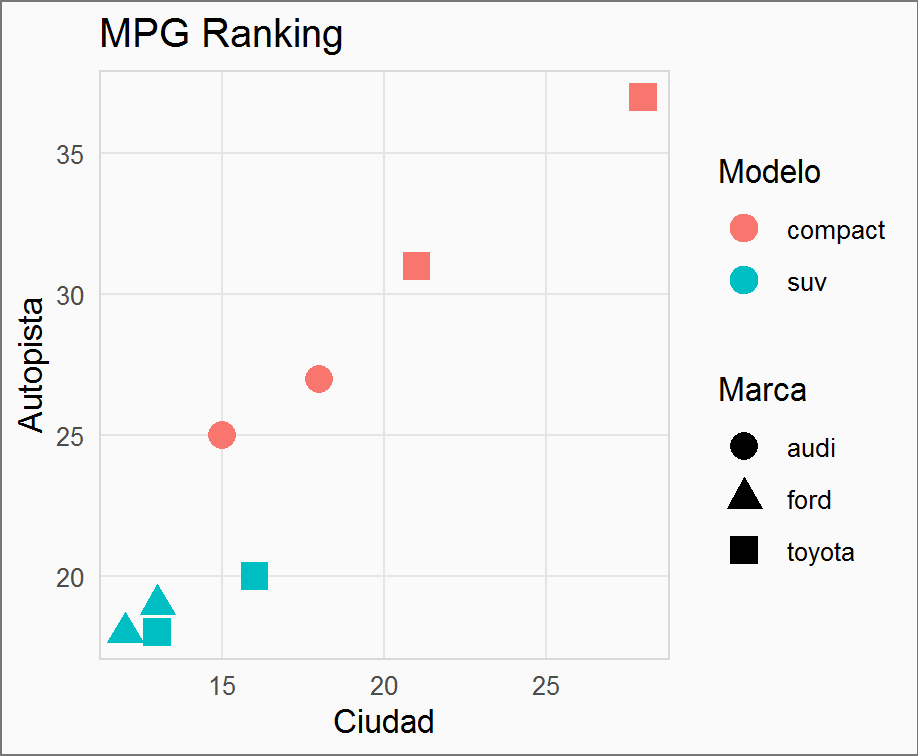
Que datos estan detras?
MPG
- Manufacturer
- Car Type (Class)
- City MPG
- Highway MPG
| manufacturer | class | cty | hwy | model |
|---|---|---|---|---|
| audi | compact | 18 | 27 | a4 |
| audi | compact | 15 | 25 | a4 quattro |
| ford | suv | 12 | 18 | expedition 2wd |
| ford | suv | 13 | 19 | explorer 4wd |
| toyota | suv | 16 | 20 | 4runner 4wd |
| toyota | compact | 21 | 31 | camry solara |
| toyota | compact | 28 | 37 | corolla |
| toyota | suv | 13 | 18 | land cruiser wagon 4wd |
Argumentos
- Data datos a ser graficados
Argumentos
- Data datos a ser graficados
- Geometric las formas que se mostraran
Argumentos
- Data datos a ser graficados
- Geometric las formas que se mostraran
- Aesthetic mappings los datos a ser representados
Argumentos
- Data datos a ser graficados
- Geometric las formas que se mostraran
- Aesthetic mappings los datos a ser representados
- Statistics datos procesados para ser visualizados
Argumentos
- Data datos a ser graficados
- Geometric las formas que se mostraran
- Aesthetic mappings los datos a ser representados
- Statistics datos procesados para ser visualizados
- Coordinates dispocision de los elementos
Argumentos
- Data datos a ser graficados
- Geometric las formas que se mostraran
- Aesthetic mappings los datos a ser representados
- Statistics datos procesados para ser visualizados
- Coordinates dispocision de los elementos
- Scales limites en los cuales varia los aes()
Argumentos
- Data datos a ser graficados
- Geometric las formas que se mostraran
- Aesthetic mappings los datos a ser representados
- Statistics datos procesados para ser visualizados
- Coordinates dispocision de los elementos
- Scales limites en los cuales varia los aes()
- Facets Produce multiples paneles
Gramatica de visualizacion
Data - Los datos
ggplot(data)Tidy Data
Cada variable una a columna
Cada observaCion es una fila
Cada mediocion es una unidad de la observacion
Gramatica de visualizacion
Data - Los datos
ggplot(data)| country | 1997 | 2002 | 2007 |
|---|---|---|---|
| Canada | 30.30584 | 31.90227 | 33.39014 |
| China | 1230.07500 | 1280.40000 | 1318.68310 |
| United States | 272.91176 | 287.67553 | 301.13995 |
Gramatica de visualizacion
Data - Los datos
ggplot(data)| country | 1997 | 2002 | 2007 |
|---|---|---|---|
| Canada | 30.30584 | 31.90227 | 33.39014 |
| China | 1230.07500 | 1280.40000 | 1318.68310 |
| United States | 272.91176 | 287.67553 | 301.13995 |
tidy_pop <- gather(messy_pop, 'year', 'pop', -country)| country | year | pop |
|---|---|---|
| Canada | 1997 | 30.306 |
| China | 1997 | 1230.075 |
| United States | 1997 | 272.912 |
| Canada | 2002 | 31.902 |
| China | 2002 | 1280.400 |
| United States | 2002 | 287.676 |
| Canada | 2007 | 33.390 |
| China | 2007 | 1318.683 |
| United States | 2007 | 301.140 |
Gramatica de Visualizacion
Data
Estetica - Aesthetics
+ aes()Informacion a ser visualizada
year
pop
country
Gramatica de Visualizacion
Data
Estetica - Aesthetics
+ aes()Informacion a ser visualizada
year → x
pop → y
country → shape, color, etc.
Gramatica de Visualizacion
Data
Estetica - Aesthetics
+ aes()Informacion a ser visualizada
aes( x = year, y = pop, color = country)Gramatica de Visualizacion
Data - Datos
Aesthetics - Estetica
Geoms - Formas
+ geom_*()Formas geometricas que se mostraran en el grafico
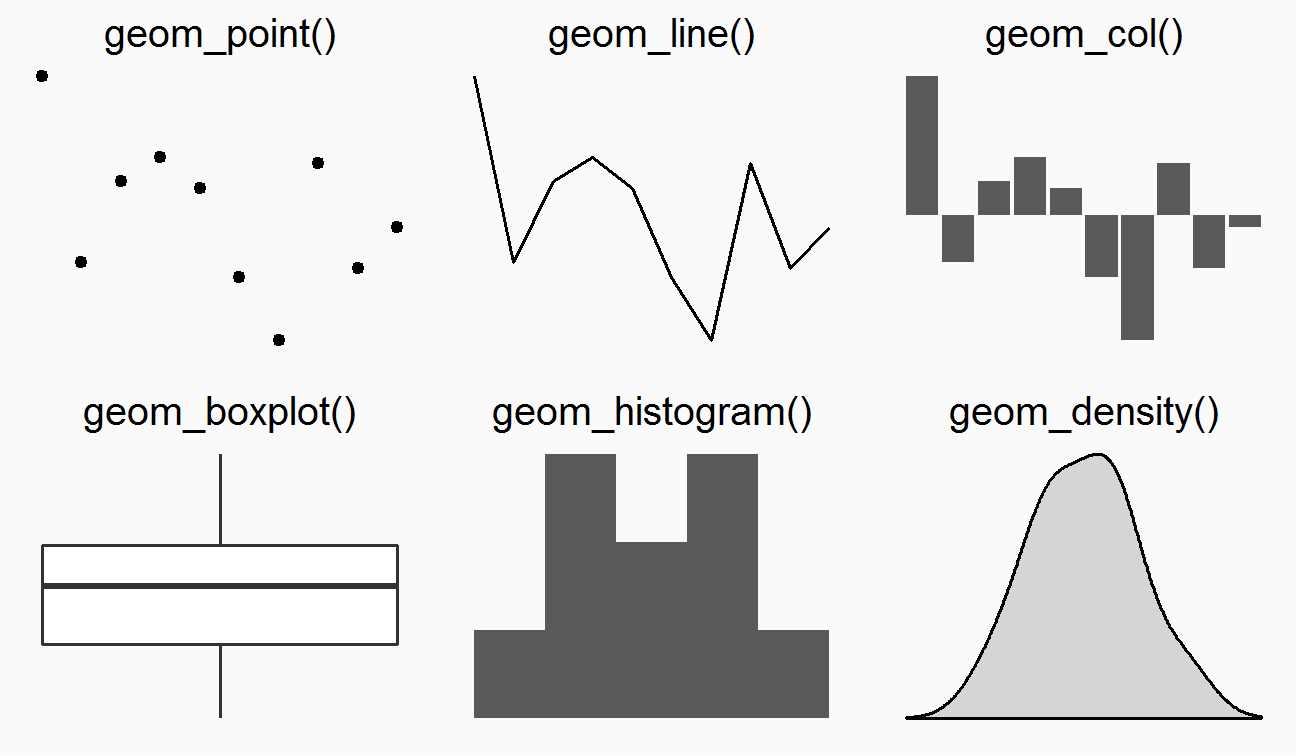
Gramatica de Visualizacion
Data - Datos
Aesthetics - Estetica
Geoms - Formas
+ geom_*()| Tipo | Funcion |
|---|---|
| Punto | geom_point() |
| Linea | geom_line() |
| Barra | geom_bar(), geom_col() |
| Histograma | geom_histogram() |
| Regrecion | geom_smooth() |
| Boxplot | geom_boxplot() |
| Texto | geom_text() |
| Linea Vertical | geom_vline() |
| Linea Horizontal | geom_hline() |
| Columnas | geom_col() |
https://eric.netlify.com/2017/08/10/most-popular-ggplot2-geoms/
Gramatica de Visualizacion
Data - Datos
Aesthetics - Estetica
Geoms - Formas
+ geom_*()Visisten http://ggplot2.tidyverse.org/reference/ para mas opciones
## [1] "geom_abline" "geom_area" "geom_bar" "geom_bin2d" ## [5] "geom_blank" "geom_boxplot" "geom_col" "geom_contour" ## [9] "geom_count" "geom_crossbar" "geom_curve" "geom_density" ## [13] "geom_density_2d" "geom_density2d" "geom_dotplot" "geom_errorbar" ## [17] "geom_errorbarh" "geom_freqpoly" "geom_hex" "geom_histogram" ## [21] "geom_hline" "geom_jitter" "geom_label" "geom_line" ## [25] "geom_linerange" "geom_map" "geom_path" "geom_point" ## [29] "geom_pointrange" "geom_polygon" "geom_qq" "geom_qq_line" ## [33] "geom_quantile" "geom_raster" "geom_rect" "geom_ribbon" ## [37] "geom_rug" "geom_segment" "geom_sf" "geom_sf_label" ## [41] "geom_sf_text" "geom_smooth" "geom_spoke" "geom_step" ## [45] "geom_text" "geom_tile" "geom_violin" "geom_vline"Gramatica de Visualizacion
Data - Datos
Aesthetics - Estetica
Geoms - Formas
+ geom_*()Visisten http://ggplot2.tidyverse.org/reference/ para mas opciones
## [1] "geom_abline" "geom_area" "geom_bar" "geom_bin2d" ## [5] "geom_blank" "geom_boxplot" "geom_col" "geom_contour" ## [9] "geom_count" "geom_crossbar" "geom_curve" "geom_density" ## [13] "geom_density_2d" "geom_density2d" "geom_dotplot" "geom_errorbar" ## [17] "geom_errorbarh" "geom_freqpoly" "geom_hex" "geom_histogram" ## [21] "geom_hline" "geom_jitter" "geom_label" "geom_line" ## [25] "geom_linerange" "geom_map" "geom_path" "geom_point" ## [29] "geom_pointrange" "geom_polygon" "geom_qq" "geom_qq_line" ## [33] "geom_quantile" "geom_raster" "geom_rect" "geom_ribbon" ## [37] "geom_rug" "geom_segment" "geom_sf" "geom_sf_label" ## [41] "geom_sf_text" "geom_smooth" "geom_spoke" "geom_step" ## [45] "geom_text" "geom_tile" "geom_violin" "geom_vline"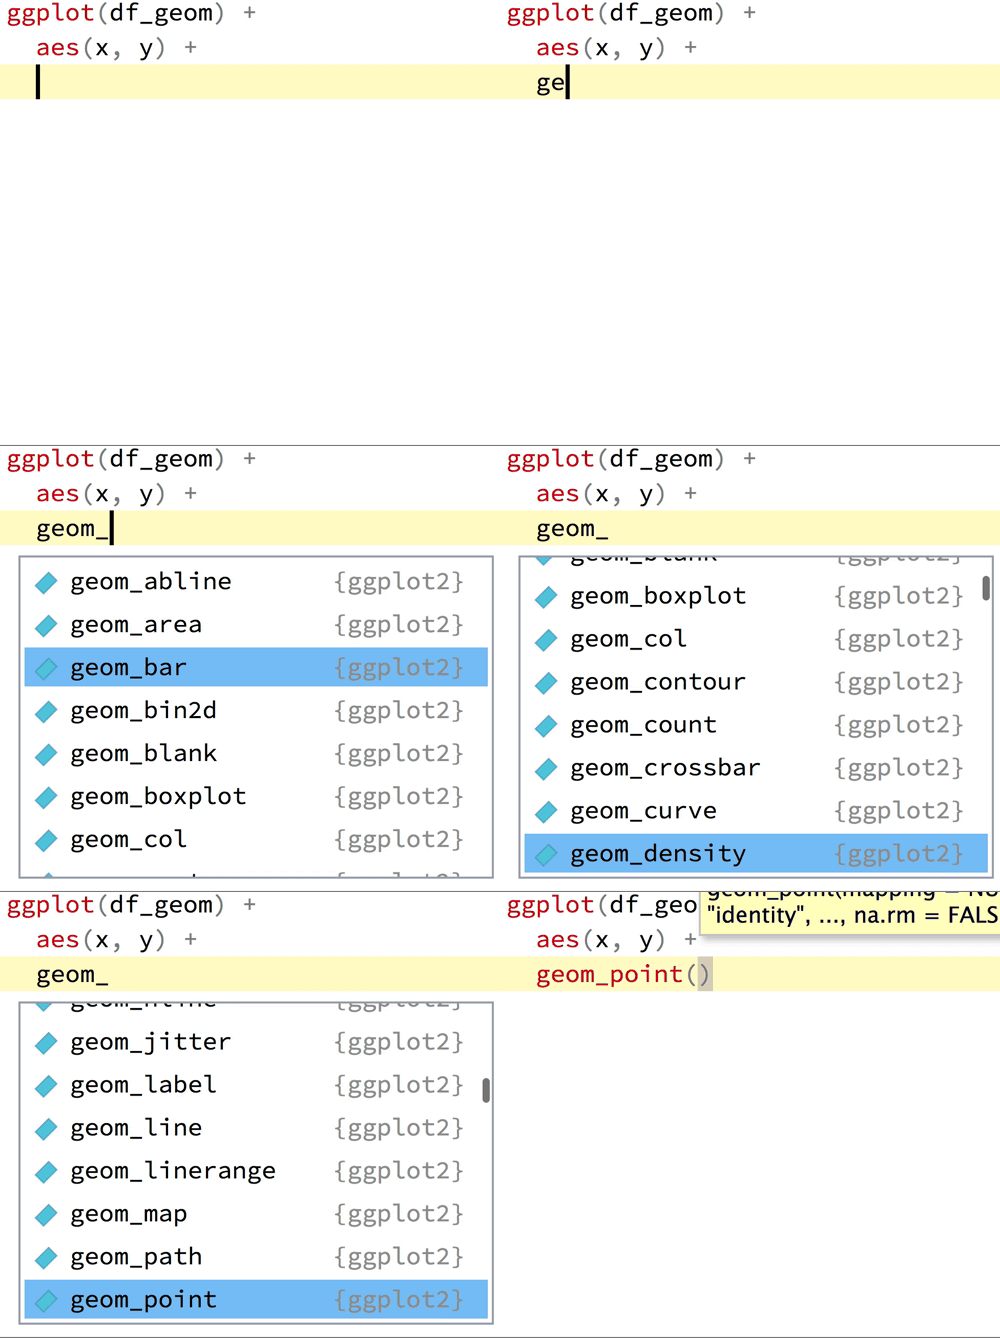 O solo escriban
 geom_ en la consola de RStudio
Nuestro primer grafico!
ggplot(tidy_pop)
Nuestro primer grafico!
ggplot(tidy_pop) + aes(x = year, y = pop)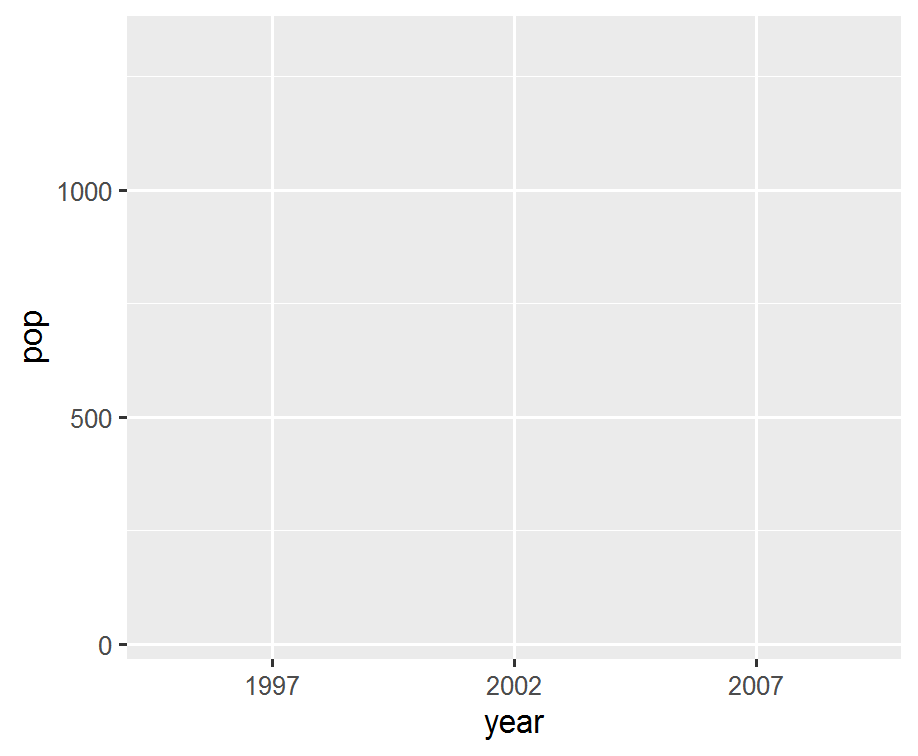
Nuestro primer grafico!
ggplot(tidy_pop) + aes(x = year, y = pop) + geom_point()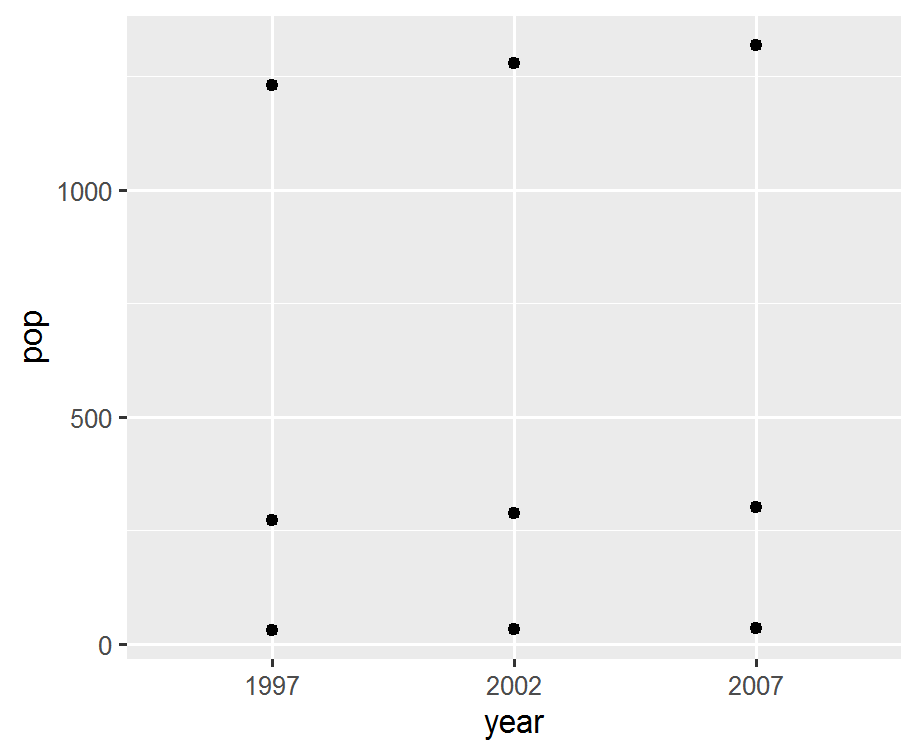
Nuestro primer grafico!
ggplot(tidy_pop) + aes(x = year, y = pop, color = country) + geom_point()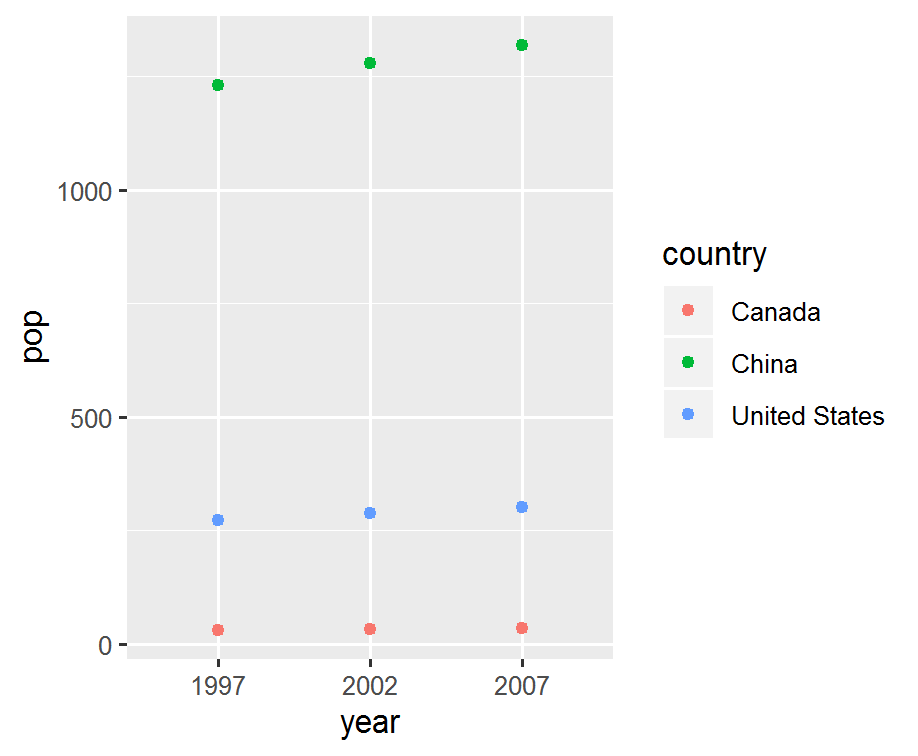
Nuestro primer grafico!
ggplot(tidy_pop) + aes(x = year, y = pop, color = country) + geom_point() + geom_line()geom_path: Cada grupo esta formado solopor una observacion. Es necesario especificar el argumento groupen aes()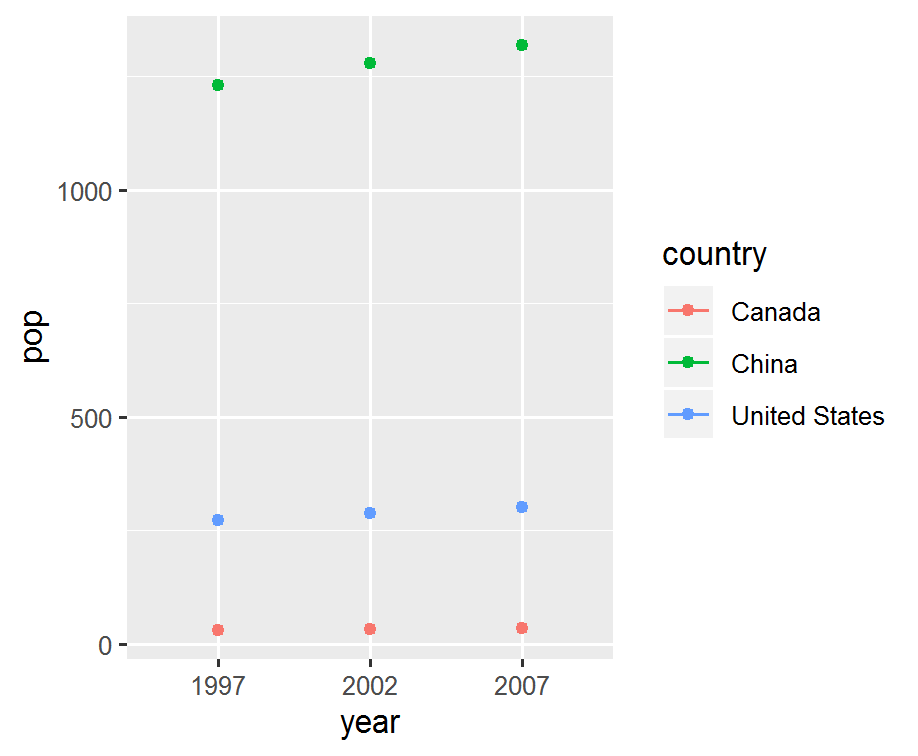
Nuestro primer grafico!
ggplot(tidy_pop) + aes(x = year, y = pop, color = country) + geom_point() + geom_line( aes(group = country))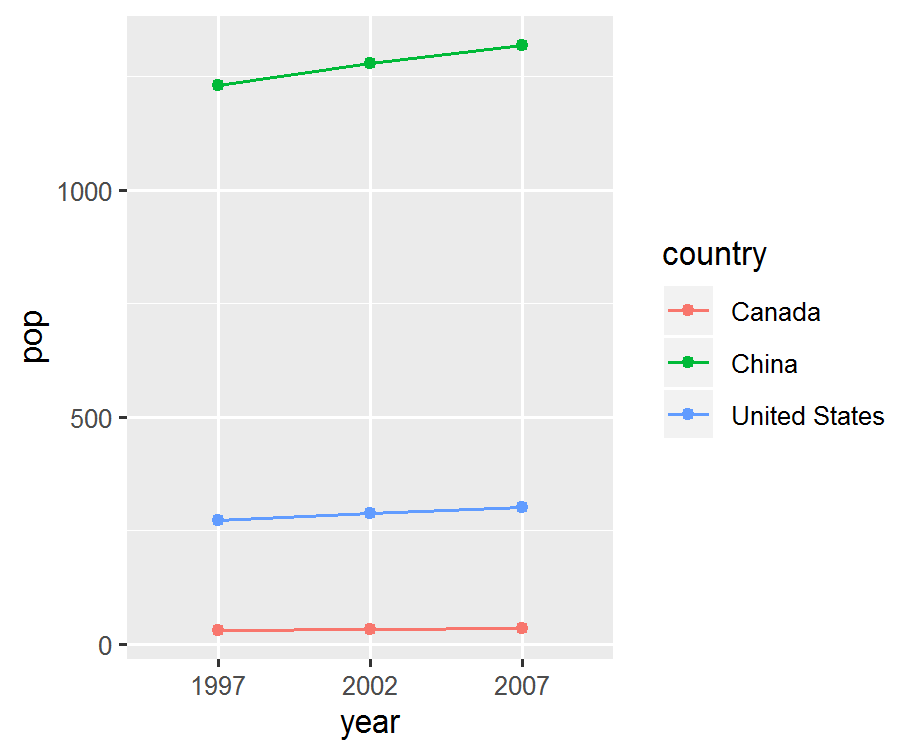
Nuestro primer grafico!
g <- ggplot(tidy_pop) + aes(x = year, y = pop, color = country) + geom_point() + geom_line( aes(group = country))g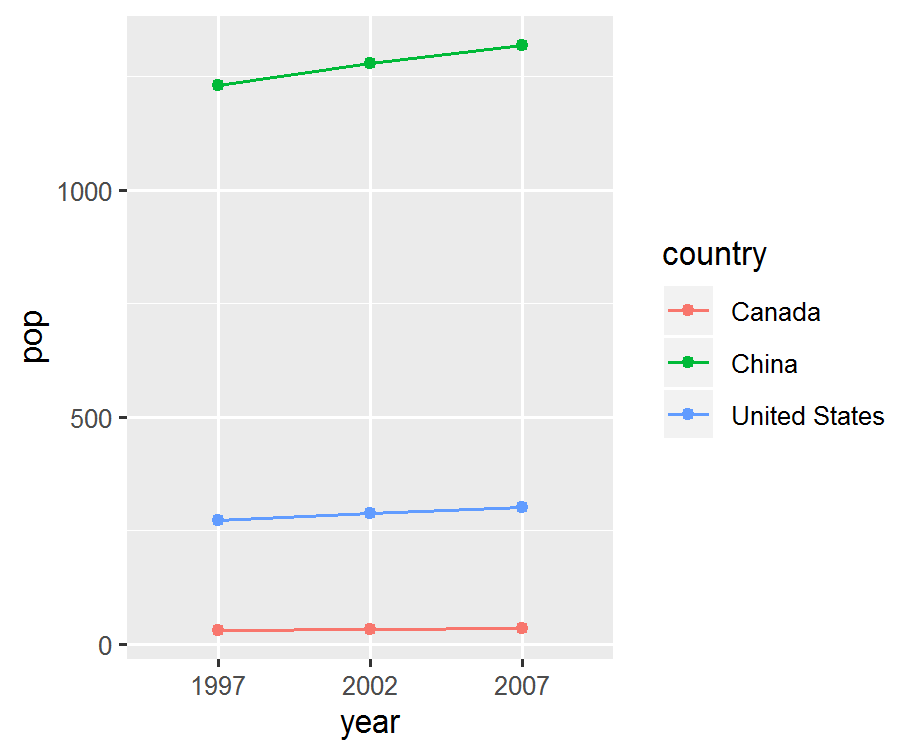
Gramatica de Visualizacion
data
aes()
geom_*()
+ geom_*()geom_*(mapping, data, stat, position)datacada geom puede tener su propia data- Mostrada en un sistema unico de coordenadas
mapgeom_*, argumentos en aes()- geom_ puede usar aes globales
- Algunos geom_ tienen argumentos especificos
geom_pointrequierex-y, opcionalshape,color,size, etc.geom_ribbonrequierex,ymin-ymax, opcionalfill
?geom_ribbon
Gramatica de Visualizacion
data
aes()
geom_*()
+ geom_*()geom_*(mapping, data, position)positionAjusta lapocision de los objetos'dodge','stack','jitter'
Gramatica de Visualizacion
Data
Aesthetics
Geoms
Facet
+facet_wrap() +facet_grid()g + facet_wrap(~ country)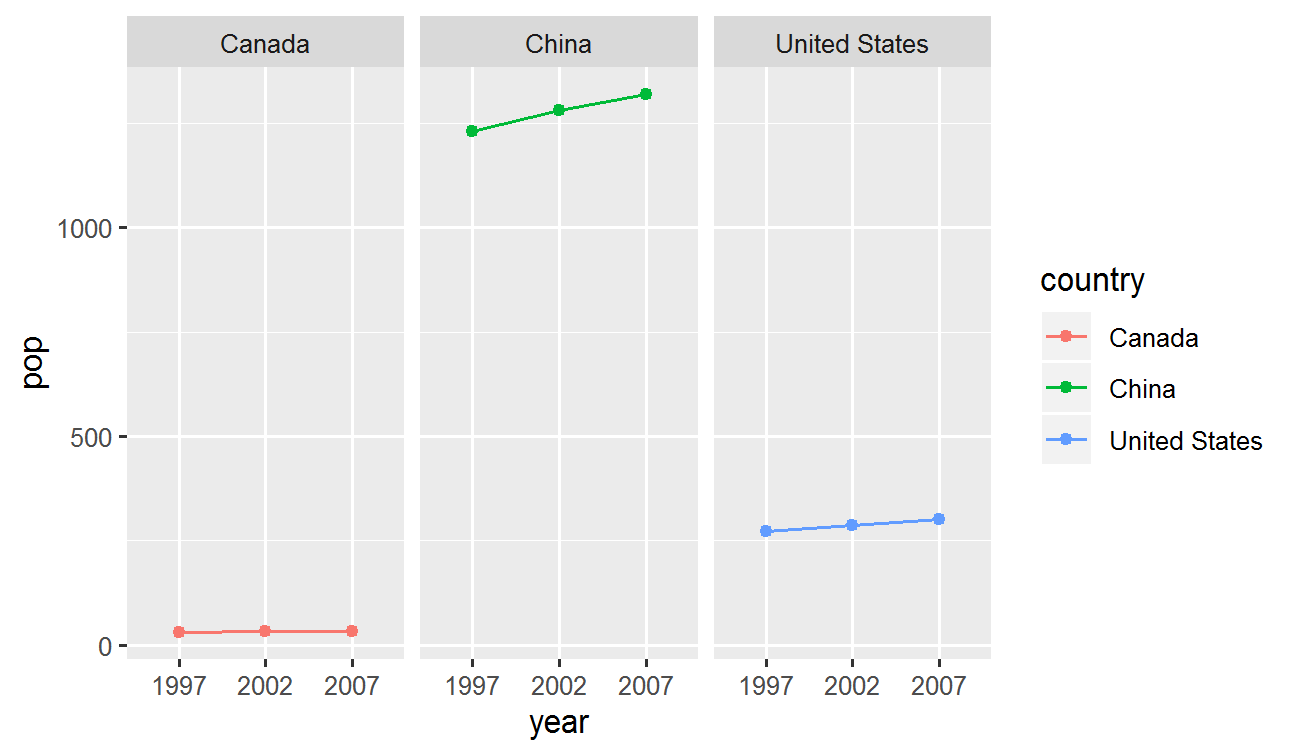
Gramatica de Visualizacion
Data
Aesthetics
Geoms
Facet
+facet_wrap() +facet_grid()g + facet_grid(continent ~ country)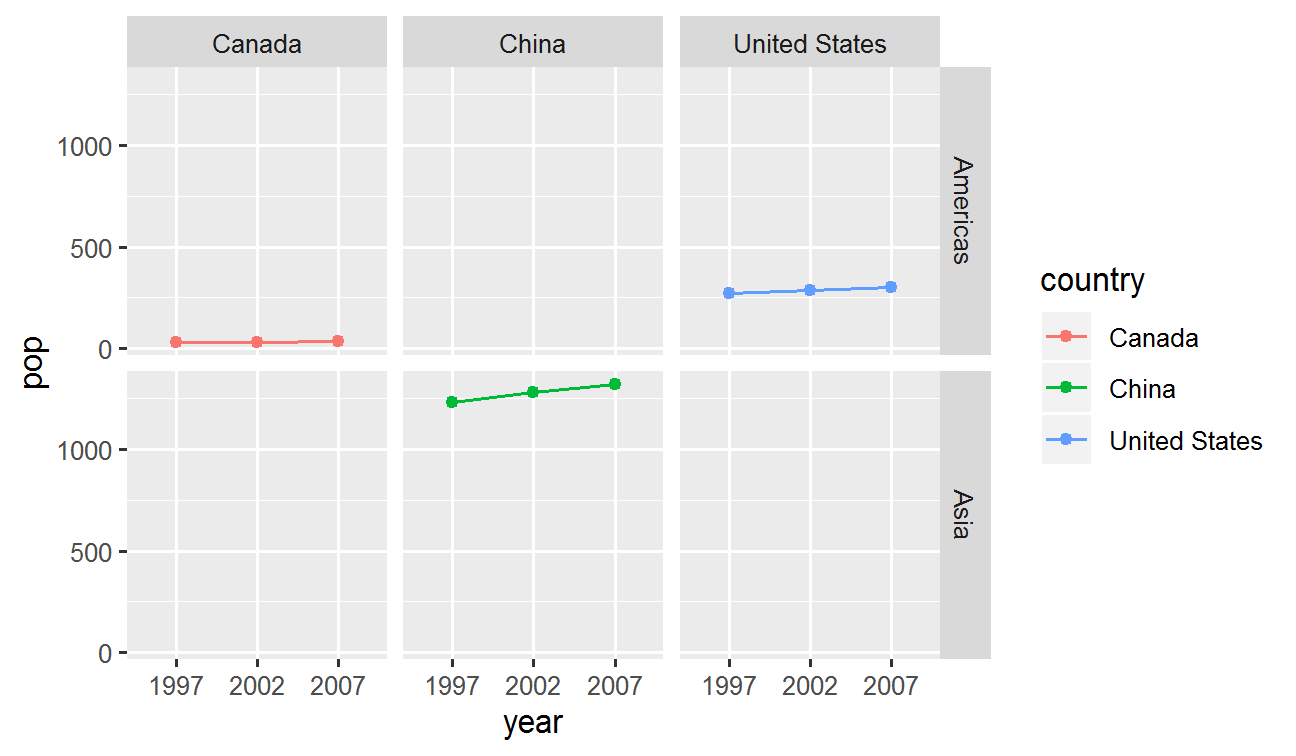
Gramatica de Visualizacion
Data
Aesthetics
Geoms
Facet
Labels
+ labs()g + labs(x = "Year", y = "Population")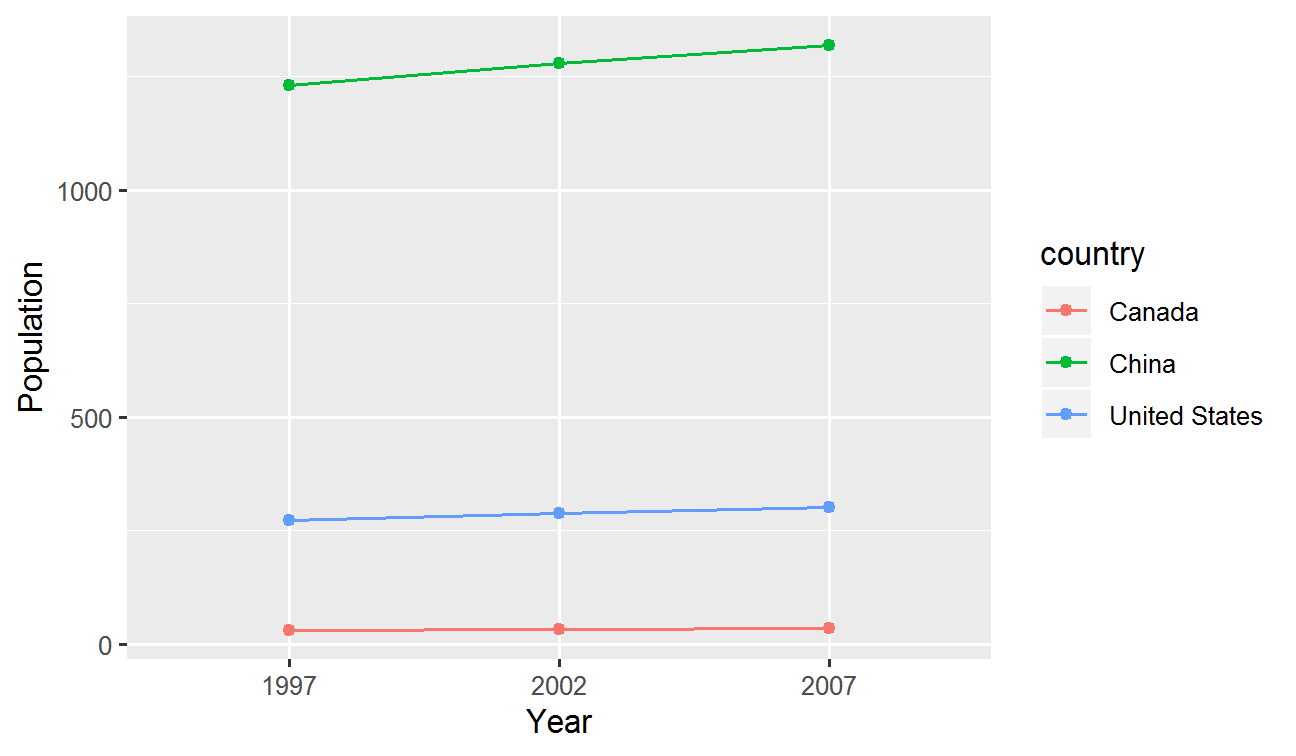
Gramatica de Visualizacion
Data
Aesthetics
Geoms
Facet
Labels
Coords
+ coord_*()g + coord_flip()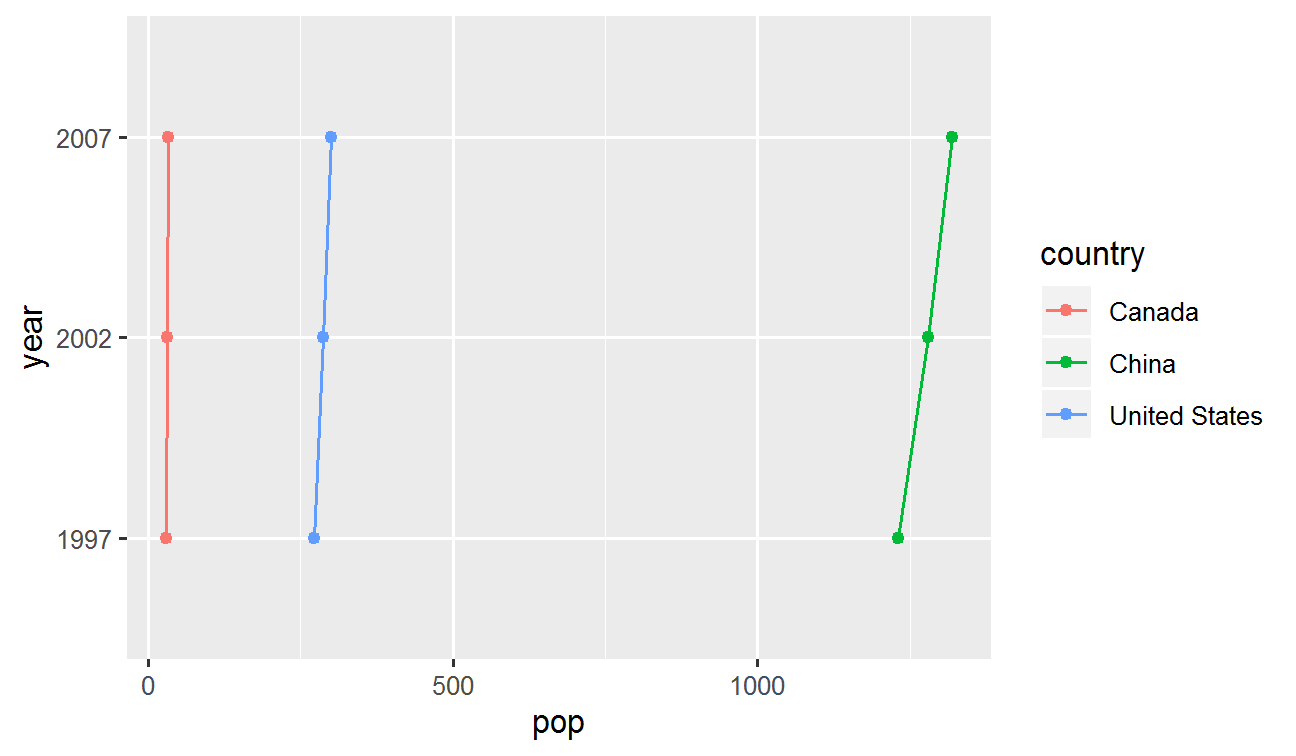
Gramatica de Visualizacion
Data
Aesthetics
Geoms
Facet
Labels
Coords
+ coord_*()g + coord_polar()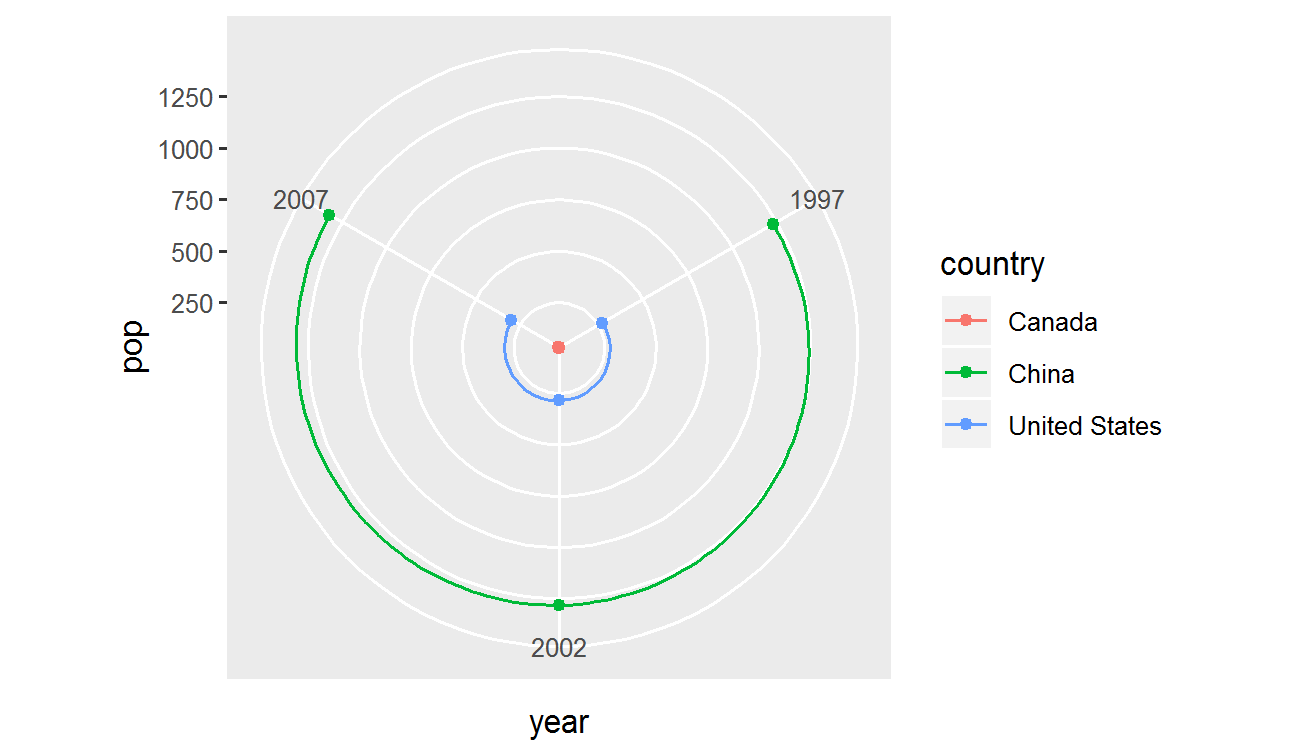
Gramatica de Visualizacion
Data
Aesthetics
Geoms
Facet
Labels
Coords
Scales
+ scale_*_*()scale + _ + <aes> + _ + <type> + ()
Que parametr deseas modificar? → <aes>
De que tipo es el parametro? → <type>
- Eje x discreto
scale_x_discrete() - Ajustar los ejes a escala logaritmica
scale_y_log10() - Para especificar los colores de forma manual
scale_fill_discrete()scale_color_manual()
Gramatica de Visualizacion
Data
Aesthetics
Geoms
Facet
Labels
Coords
Scales
+ scale_*_*()g + scale_color_manual(values = c("peru", "pink", "plum"))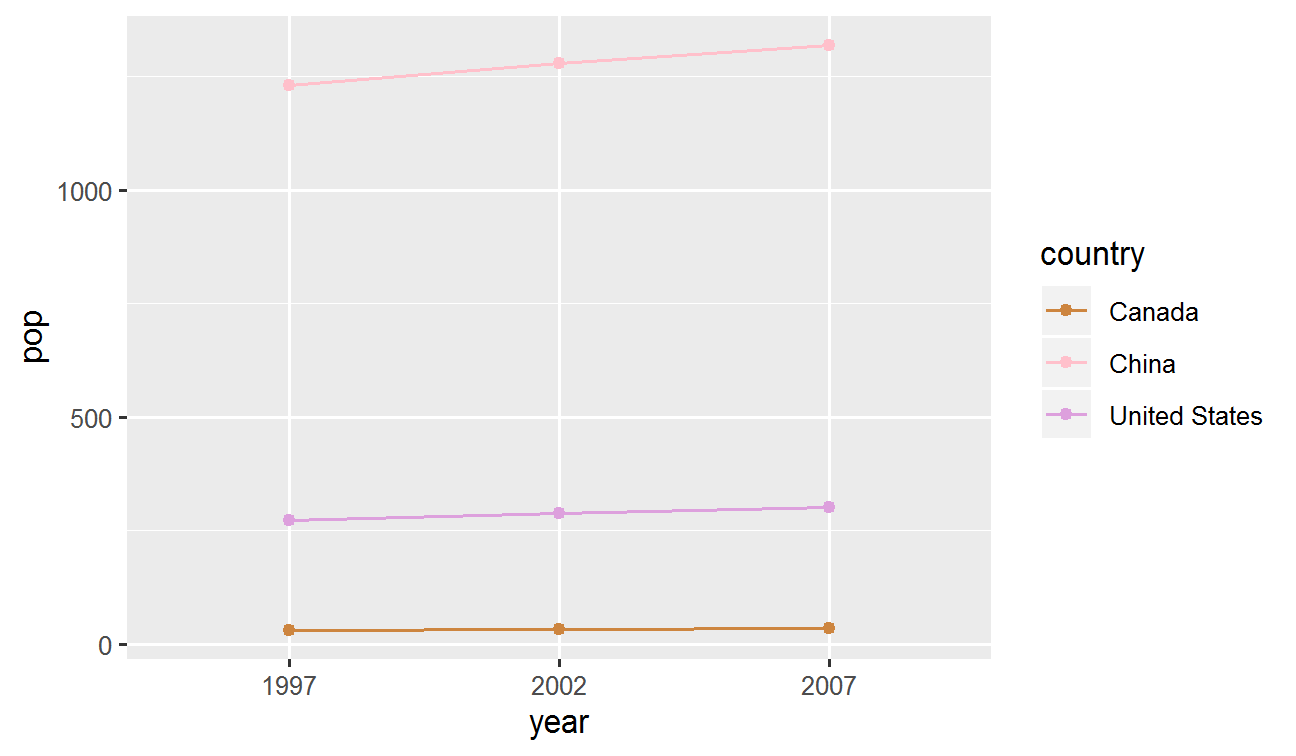
Gramatica de Visualizacion
Data
Aesthetics
Geoms
Facet
Labels
Coords
Scales
+ scale_*_*()g + scale_y_log10()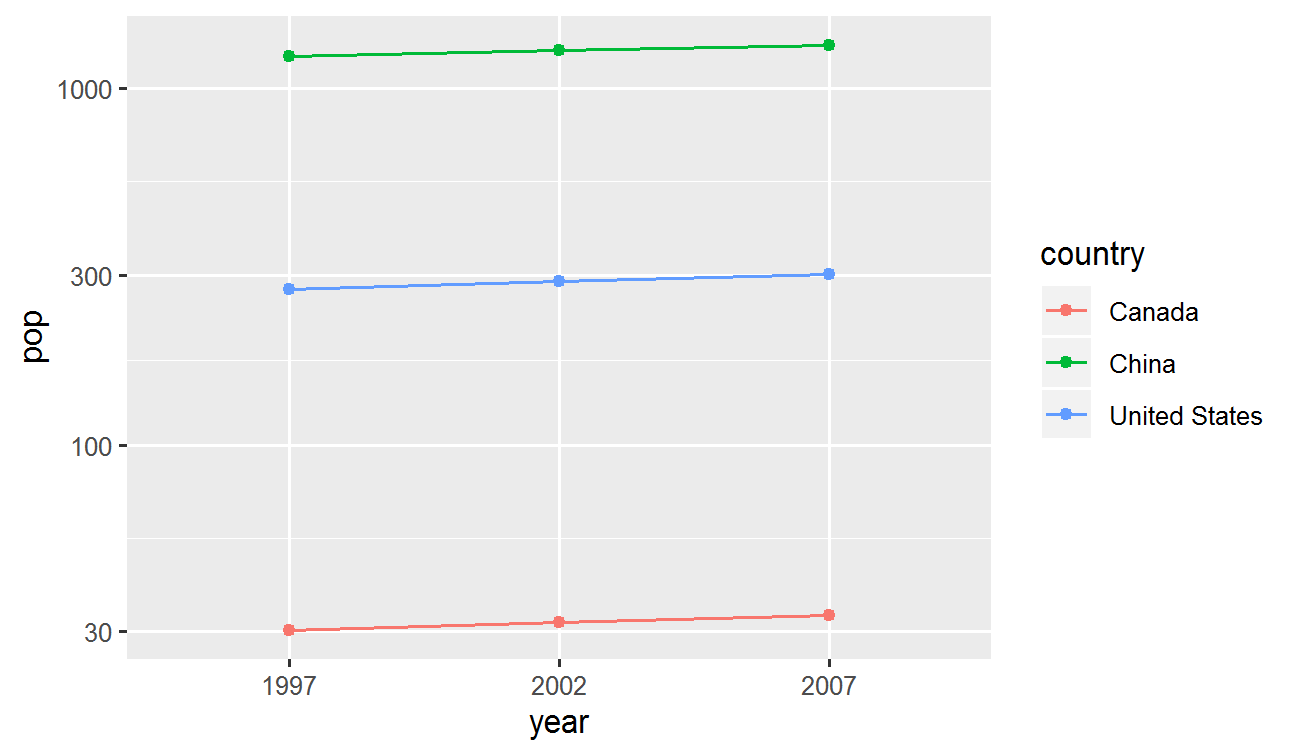
Gramatica de Visualizacion
Data
Aesthetics
Geoms
Facet
Labels
Coords
Scales
+ scale_*_*()g + scale_x_discrete(labels = c("MCMXCVII", "MMII", "MMVII"))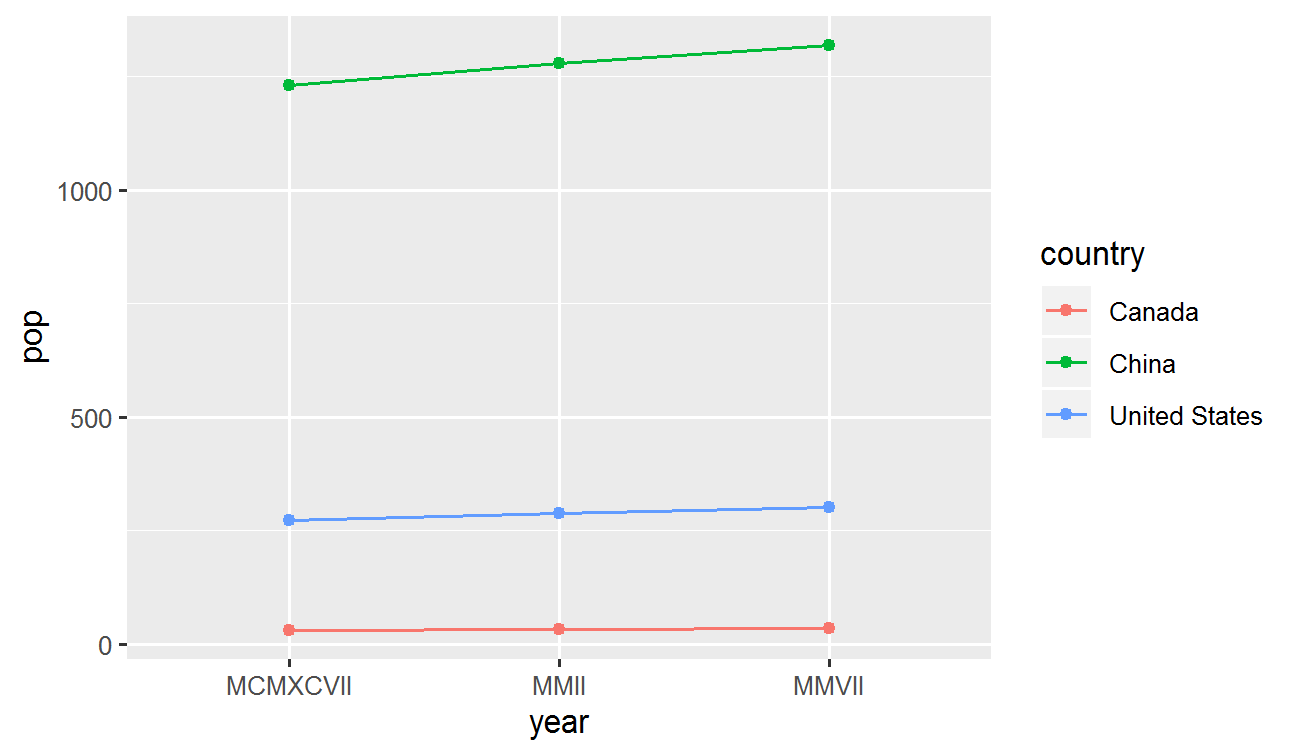
Gramatica de Visualizacion
Data
Aesthetics
Geoms
Facet
Labels
Coords
Scales
Theme
+ theme()Se puede manipular la apariencia del grafico
Algunas opciones dentro de ggplot2
g + theme_bw()g + theme_dark()g + theme_gray()g + theme_light()g + theme_minimal()
Gramatica de Visualizacion
Data
Aesthetics
Geoms
Facet
Labels
Coords
Scales
Theme
+ theme()Se tiene un gran numero de parametros,
agrupadas por el area de trabajo:
- Opciones globales:
line,rect,text,title axis: x-, y-, title, ticks, lineslegend: leyendapanel: area actual de trabajoplot: todo el panelstrip: etiquetas de los sub paneles
Gramatica de Visualizacion
Data
Aesthetics
Geoms
Facet
Labels
Coords
Scales
Theme
+ theme()Para modificar los elementos se cuenta con:
element_blank()elimina los elementoselement_line()element_rect()element_text()
Gramatica de Visualizacion
Data
Aesthetics
Geoms
Facet
Labels
Coords
Scales
Theme
+ theme()g + theme_bw()
Gramatica de Visualizacion
Data
Aesthetics
Geoms
Facet
Labels
Coords
Scales
Theme
+ theme()g + theme_minimal() + theme(text = element_text(family = "Palatino"))
Gramatica de Visualizacion
Data
Aesthetics
Geoms
Facet
Labels
Coords
Scales
Theme
+ theme()Pueden cargar un tema como opcion por defecto con: theme_set()
my_theme <- theme_bw() + theme( text = element_text(family = "Palatino", size = 12), panel.border = element_rect(colour = 'grey80'), panel.grid.minor = element_blank() )theme_set(my_theme)Todos los graficos pueden usar ahora este tema!
Gramatica de Visualizacion
Data
Aesthetics
Geoms
Facet
Labels
Coords
Scales
Theme
+ theme()g
Gramatica de Visualizacion
Data
Aesthetics
Geoms
Facet
Labels
Coords
Scales
Theme
+ theme()g + theme(legend.position = 'bottom')
Como guardar las imagenes
Se tiene la funcion, ggsave( )
ggsave( filename = "my_plot.png", plot = my_plot, width = 10, height = 8, dpi = 100, device = "png")install.packages("ggalt")
library(ggalt)df <- tibble(trt = LETTERS[1 : 10], value = seq(100, 10, by = -10))ggplot(df, aes(trt, value)) + geom_lollipop()
install.packages("gqqplotr")
library(qqplotr)set.seed(0)smp <- data.frame(norm = rnorm(100))# Normal Q-Q plot of Normal datagg <- ggplot(data = smp, mapping = aes(sample = norm)) + stat_qq_band() + stat_qq_line() + stat_qq_point()gg + labs(x = "Theoretical Quantiles", y = "Sample Quantiles")
Donde buscar ayuda
ggplot2 docs: http://ggplot2.tidyverse.org/
R4DS - Data visualization: http://r4ds.had.co.nz/data-visualisation.html
Hadley Wickham's ggplot2 book: https://www.amazon.com/dp/0387981403/